Metrics
Hashboard Metrics allow you to centralize key metric definitions to keep your organization on the same page. Easily track KPIs and trends across your project from the Metrics page.
Metrics are a quantifiable value used to assess and evaluate the performance, progress, or effectiveness of your organization. By regularly measuring and analyzing your Hashboard metrics, your organization can gain valuable insights into your overall performance and inform future decision-making.
Metric types
Total
Total metrics are the simplest type of metric. They are a single value that represents the total of all values for the selected measure. For example, a total metric might be total number of user registrations all time.
On the metrics page, total metrics will display a value but no trend line.
Total metrics can include filters as well over any attribute on the data model for the selected measure. For example, a total metric with a filter might be total number of user registrations all time for users in a particular region. To create a total metric, make sure your metric's configuration has the Dimension field set to None.
Timeseries
Timeseries metrics are a series of values over time for the selected measure. For example, a timeseries metric might be number of user registrations per day over the last 30 days.
On the metrics page, timeseries metrics will display a value and a trend line.
Like total metrics, timeseries metrics can include filters over any attribute on the data model for the selected measure. For example, a timeseries metric with a filter might be number of user registrations per day over the last 30 days for users in a particular region. To create a timeseries metric, make sure your metric's configuration has the Dimension set to a date or datetime attribute, rather than None.
Metric page
The Metrics page has two different modes, divided into two tabs— the Metric tree tab and the Metric library tab.
Metric tree
The metric tree is a structured way to visualize and understand the relationships between your business metrics. By organizing metrics into a hierarchical tree structure, you can easily see how lower-level driver metrics contribute to top-line metrics. This tool helps diagnose performance issues and attribute variations in key metrics to specific drivers.
Types of metric tree metrics
- Top-line metrics: Your primary business goals. Sometimes called North Star metrics.
- Driver metrics: Metrics that contribute to the output of another metric. Driver metrics can be inputs for top-line metrics or intermediate driver metrics.
Creating your metric tree
- Navigate to the Metric tree: Access the Metric tree from the Metrics page by selecting the Metric Tree tab.
- Identify Top-Line Metrics: Start by selecting your the top-line metrics, which represent your primary business goals.
- Add Driver Metrics: Click on the more menu of any top-line metric to reveal the option to add one or more driver metrics.
Metric library
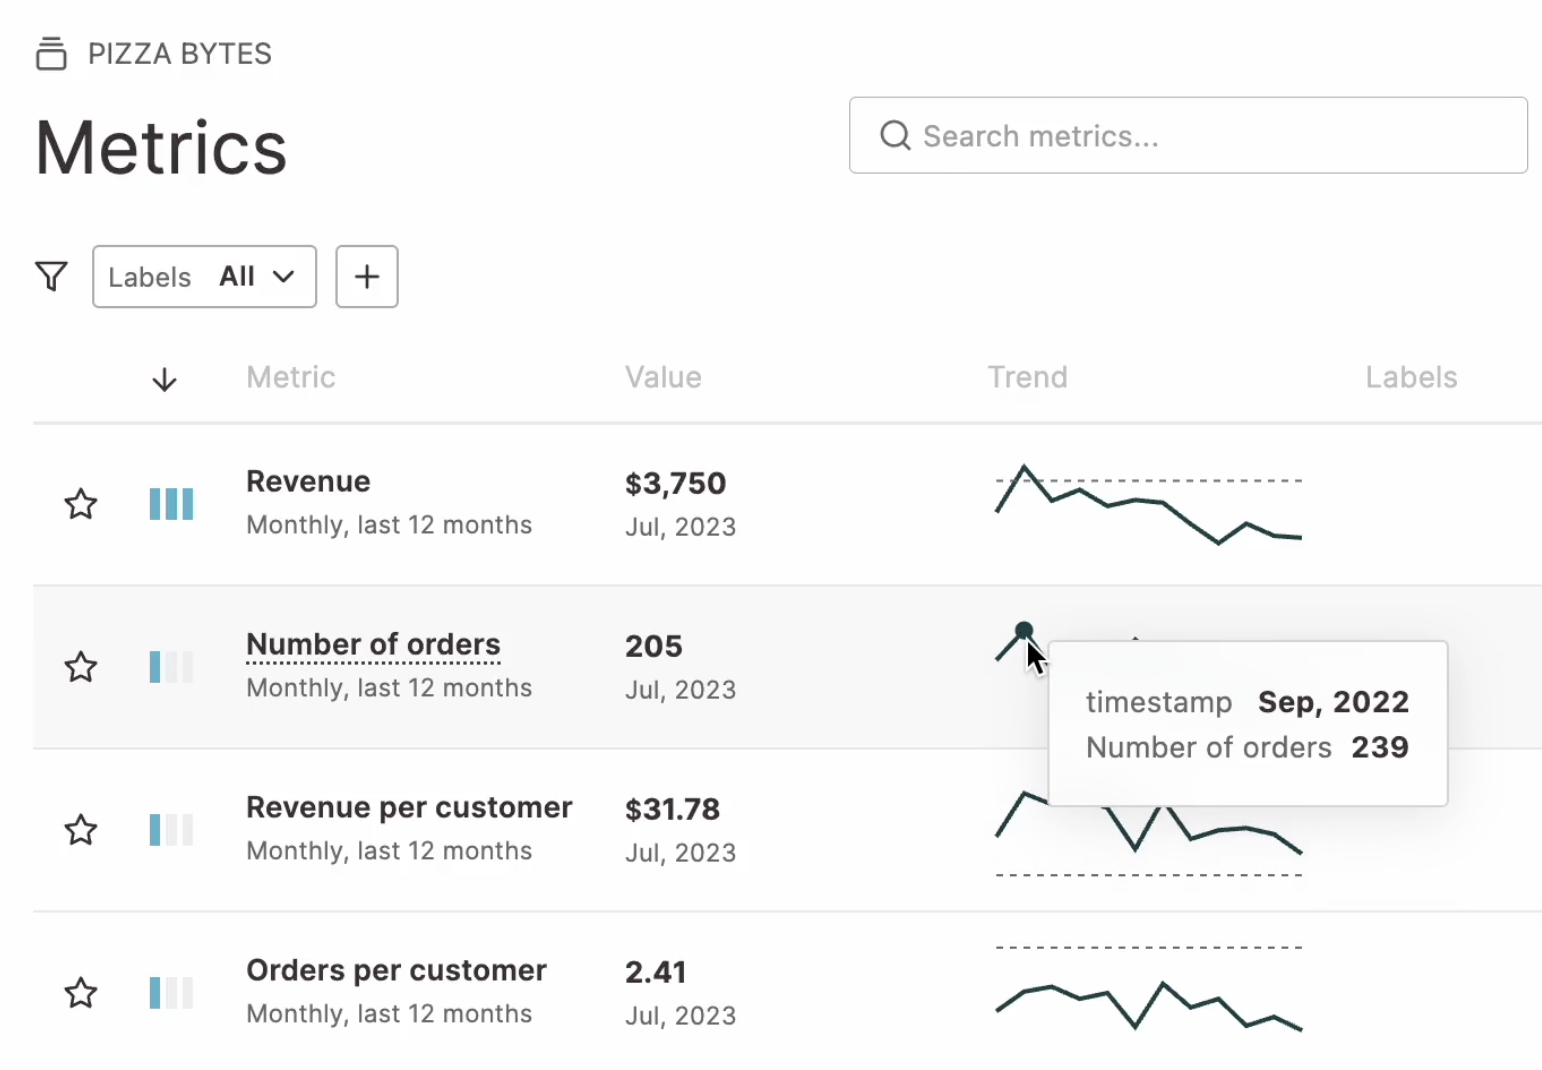
The metrics library is where you can view all of the metrics in your project. To navigate to the Metrics library, click the Metrics link in the left sidebar and select the Metrics library tab.
Once on the Metric library tab you should see all your metrics listed with information like the metric name, the current value of the metric, and a trend line if the metric is a timeseries metric.
You can search for a specific metric by name using the search bar at the top of the page. You can also filter the metrics by label, data model, timeseries granularity using the filter bar at the top of the page.
Metrics can also be sorted by a variety of fields by clicking the column header for the field you want to sort by. Clicking the column header again will reverse the sort order.
Defining your metrics
Creating and editing a metric
Metrics are created from measures on a data model. So before you can create a metric, you need add at least one data model to your project. Once you have a data model, you can create a metric by following these steps:
- Navigate to the metrics page from Metrics link in the left sidebar and select the Metric library tab.
- Click the New metric button in the top right of the metrics page.
- The metric dialog with open will appear. From here you can configure the various aspects of the metric.
- Name - The name of the metric.
- Description - A description of the metric.
- Model - The data model the metric is based on.
- Measure - The measure the metric is based on.
- Dimension - The dimension of the metric. This is the attribute on the data model that the metric is grouped by. For example, if you have a timeseries metric for number of user registrations per day, the dimension would be the date attribute on the user registrations data model.
- Granularity - The granularity of the metric. This is the time period that the metric is grouped by. For example, if you have a timeseries metric for number of user registrations per day, the granularity would be day.
- Filters - Filters are used to limit the data that is included in the metric. For example, you might want to limit a metric to only include data for a particular region. Filters can be added for any attribute on the data model.
- Show the last - The number of time periods to include in the metric. For example, if you have a timeseries metric for number of user registrations per day, and you set the granularity to day and the show the last to 30, the metric will include the last 30 days of data.
- Display current (incomplete) time period - Whether or not to include the current time period in the metric. For example, if you have a timeseries metric for number of user registrations per day, and you set the granularity to day and show the last 30 days, and setting this toggle to true the metric will include the last 30 days of data plus the current day even if that current period is still in progress.
- Goal - The goal of the metric. This is the target value for the metric. Setting a value and comparison type will cause trend line include a a goal line.
- Once you have finished configuring the metric, click the Save button.
Trashing and deleting metrics
- If not already on the metrics page, navigate to the metrics page from Metrics link in the left sidebar.
- Find the metric you want to edit and click the more menu (three dots) button on the right side of the metric row.
- Select Move to trash from the menu.
- A confirmation dialog will appear. Click the Move to trash button to confirm.
- The metric will be moved to the trash. To permanently delete the metric, navigate to the Trash page and delete the metric from there with the Delete permanently button. Optionally you can restore the metric from the trash by clicking the Restore button.
Exploring metrics
Metrics are a great place to start exploring your data. You can use the metrics page to quickly view and compare metrics across your organization.
Often though, you may want to explore your metrics in more detail. For example, you might want to see the underlying data that makes up a metric, or you might want to see how the metric might change if you changed the filters. Clicking the metric from the metrics page will take you to the Data Explorer where you can explore the metric in more detail. When you first arrive in the Data Explorer from the metrics page, you will see the metric you clicked on selected in the the Data Tray. From the Data Tray you can quickly switch to view another metric from the the same data model by clicking on the metric in the Data Tray.
As you make changes in the Data Explorer, like adding new filters, breakouts, or trellises you will see the metric is no longer selected in the Data Tray. This is because your current exploration has diverged from the metric's configuration. You can click the metric in the Data Tray at any time to go back to the metric's configuration.
Metrics in dashboards
With metrics, you can skip the configuration of a dashboard metric block by populating a metric block's configuration from a metric. There are two ways to use metrics to populate metric blocks, the metric can either be linked directly or the metric definition can be copied into a block. Linked metrics will be updated when the metric definition is updated at the project level while copied metrics provide a starting point for building custom dashboard metric blocks that are only updated when the block itself is modified.
When using metrics in dashboards, follow these steps:
- Navigate to the dashboard you want to update.
- Click the Edit button in the top right of the dashboard.
- Find the existing metric block you wish to update, or create a new metric block.
- Open the metric block's configuration by clicking the settings icon in the top right of the metric block.
To link a metric block to a metric:
- Click the Linked Metric tab
- Select the metric you want to reference from the Linked Metric dropdown
- Your metric block will now display the selected metric, to make changes to the value displayed you can edit the metric definition from the Metrics page.
- Once you have finished editing the dashboard, click the Save button in the top right of the dashboard.
To copy a metric's configuration into a metric block:
- Click the Custom Metric tab
- Expand the Copy metric configuration section and select your metric from the list of available metrics.
- With your metric selected, click the Copy config button.
- Your metric block's configuration will be updated with the configuration from your metric. You can open the metric block's configuration to review the settings or make additional changes.
- Once you have finished editing the dashboard, click the Save button in the top right of the dashboard.
Metrics as code
Metrics can be defined and controlled as code, allowing for better version control and recovery. Visit the Metric schema page to learn about how metrics can be defined, to learn more about the basics of code based workflows for Hashboard resources please visit our developer reference.
Are you looking for measures? Hashboard previously used the term metric to refer to what is now called a measure. Read more about measures.