Table Controls
Table visualizations can be configured both in the control panel, and directly via controls on the table.
Control Panel
Filters
Use this section to apply filters to your dataset. To add a new filter, click the + button.
For more information on how to use filters, see the Filtering documentation.
Table options
This section contains options for customizing the appearance of the table.
- Palette: Defines the color for breakout values.
- Compact Padding: Reduces space between table cells.
- Hide Zero Values: When enabled, zeros are rendered as blank cells in the table.
- Visualizations: Add bar visualizations within table cells.
- Formatting rules: Apply conditional formatting to table cells.
- Subtotals: Adds subtotals and a grand total to your table. Subtotals are calculated per table group (i.e. for each table attribute, including the breakout if it exists), and are calculated before the row limit is applied.
Rows
Use this section to set the aggregation level for each row by choosing one or more attributes.
Additional options:
- Sort order: Configures how attribute values are ordered in the visualization.
- Limit rows: Configures the maximum number of rows that will be displayed. Defaults to 10,000.
Breakout
This section allows you to group your data based on the values of an attribute. Tables can have up to one Color Breakout applied. For additional information about Breakouts, see the Breakout documentation.
Columns
Add columns to pivot your table by. You can add any number of columns as long as each column is not already used in rows or as a breakout, and reorder columns to determine the level at which they are nested.
Measures
Use this section to configure which measures will be displayed in the table.
Header Configurations
You can edit individual columns by clicking on their headers in the table. Many common actions, such as sorting, are available in these menus.
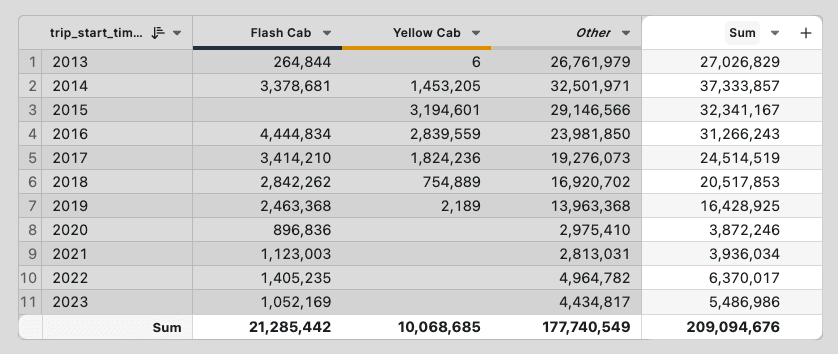
Calculating Row/Column Summaries
To add a calculation across a row/column, select "Summarize" in the table header
you want to summarize, or in the + menu on the right edge of the table for
row-wise summaries.
Summaries are currently all calculated post-aggregation, after querying your database.
Measure Filters
Click the header of a measure column to add a post-aggregation filter to it. This filter out any rows that don't match the post-aggregation filter condition.